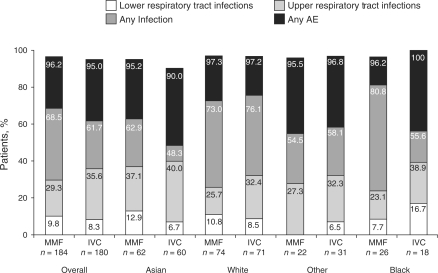
Fig. 2.
Percentage of patients reporting AEs, by race and treatment group. Patients could experience more than one AE. Any infection includes lower and upper respiratory tract plus any other infections. Any AE includes infections plus other AEs. Groups of AEs are not exclusive. Values on the y-axis represent a cumulative percentage; for example, the value for any AE represents the total percentage of patients with lower and upper respiratory tract infection, any other infection plus any other AE.

