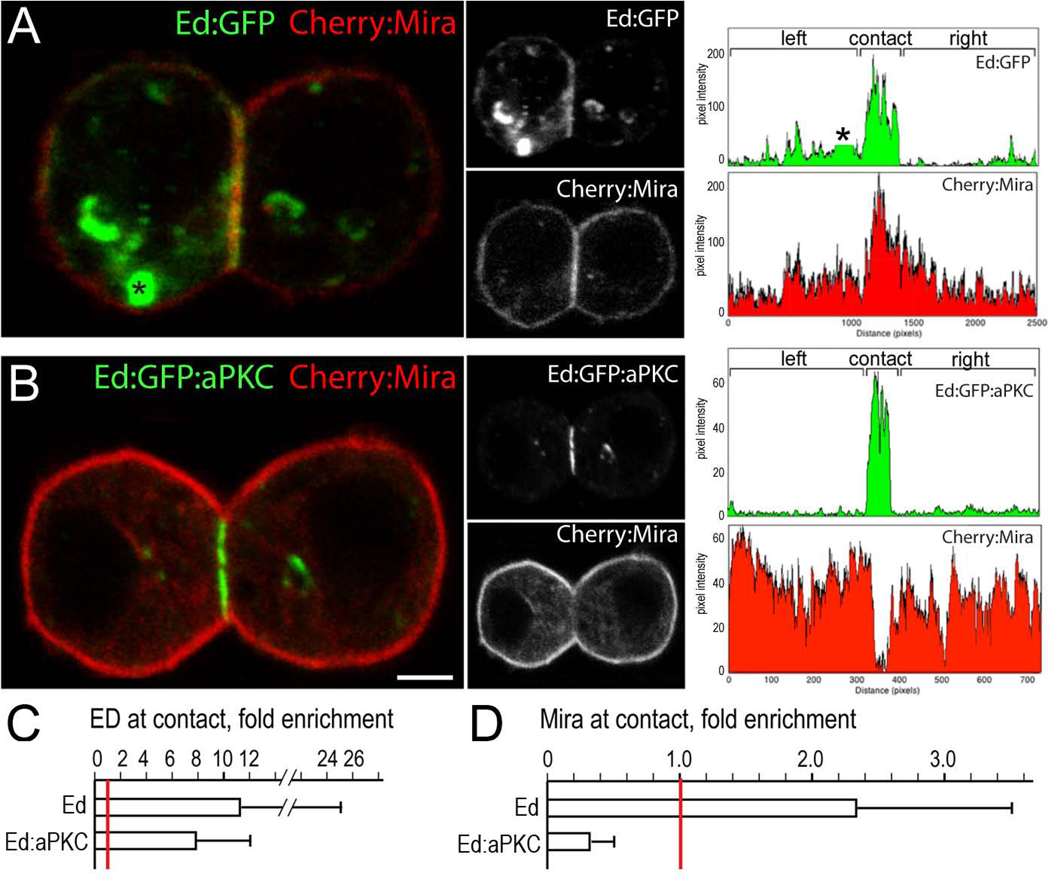
Figure 1. Induced cell polarity in Drosophila S2 cells.
(A) The Echinoid (Ed) induced cortical polarity in S2 cells. Cortical polarization of Ed:GFP fusion protein (green); there is also cytoplasmic vesicle staining (asterisk); Cherry:Miranda protein (red) shows less cortical enrichment. Right: quantification of cortical pixel intensity (vesicle staining removed from plot).
(B) Induced functional cortical polarity in S2 cells. Polarized Ed:aPKC can exclude Cherry:Miranda (Mira) from the cortex, thereby inducing Cherry:Mira cortical polarization. Right: quantification of cortical pixel intensity. Scale bar 3 µm.
(C) Ed and Ed:aPKC are enriched at the site of cell-cell contact. Pixel intensity was measured for left (L), right (R), and contacting (C) cortical domains and fold enrichment at the contact site was calculated (C/L+R). Red line indicates a ratio of 1.0 (no enrichment or exclusion). n = 17 (Ed) and 18 (Ed:aPKC).
(D) aPKC excludes Miranda from the cortex. Cherry:Mira pixel intensity levels were measured as described in panel C. Red line indicates a ratio of 1.

