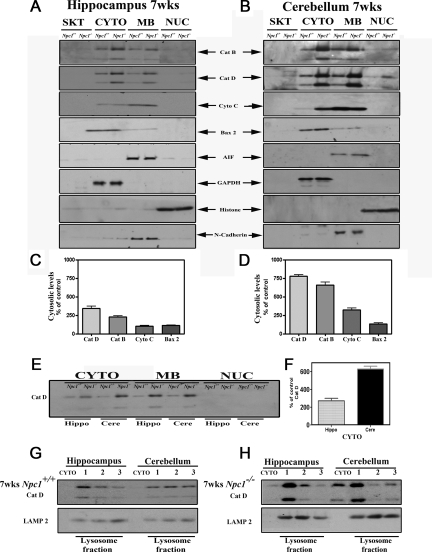
Figure 7.
A–D: Immunoblots (A and B) and respective histograms (C and D) showing subcellular distribution of cathepsin B, cathepsin D, cytochrome c, Bax2, and AIF in the hippocampus and cerebellum of 7-week-old control and Npc1−/− mice. The subcellular fractions were prepared using Qproteome Cell Compartment kit. Note the relatively higher cytosolic levels of cathepsins, cytochrome c, and Bax2 in the cerebellum compared with hippocampus. No marked alterations in AIF levels were evident in Npc1−/− mice compared with controls. Histograms represent quantification of cathepsins, cytochrome c, and Bax2 levels from at least three separate experiments, each of which was replicated two times. E and F: Immunoblot and corresponding histogram showing changes in the subcellular levels of cathepsin D in the hippocampus and cerebellum of 7-week-old control and Npc1−/− mouse brains run on the same gel. Note the relative increase in the cytosolic cathepsin D level in the cerebellum compared with that in the hippocampus. G and H: Immunoblot showing cytosolic and lysosomal levels of cathepsin D in the hippocampus and cerebellum of 7-week-old control (G) and Npc1−/− (H) mouse brains. The lysosomal and cytosolic fractions were prepared using a lysosomal isolation kit. Note the relatively higher cytosolic levels of cathepsin D in the cerebellum compared with hippocampus. Cat B, cathepsin B; Cat D, cathepsin D; Cere, cerebellum; Cyto c, cytochrome c; CYTO, cytoplasmic; GAPDH, glyceraldehyde-3-phosphate dehydrogenase; Hippo, hippocampus; MB, membrane; NUC, nuclear, SKT, cytoskeletal.

