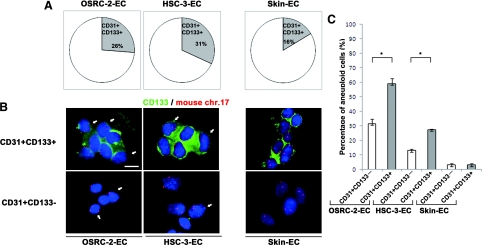
Figure 6.
Percentage of CD133+ cells among mTECs/mNECs and its correlation with aneuploidy. A: The percentage of CD133+ cells in mTECs was 26% (OSRC-2-ECs) and 31% (HSC-3-ECs), whereas that in mNECs was 16%. B: Uncultured mTECs or mNECs were immunostained with CD133 followed by FISH. Nuclei were counterstained with DAPI (blue). Three or more chromosome 17 signals (red) were detected in CD133+ (green) and CD133− mTECs (white arrows), whereas CD133+ and CD133− mNECs cells were diploid. C: Among mTECs, aneuploid cells were observed more frequently in CD31+CD133+ cells than in CD31+CD133− cells (∗P < 0.05). Scale bar, 10 μm.

