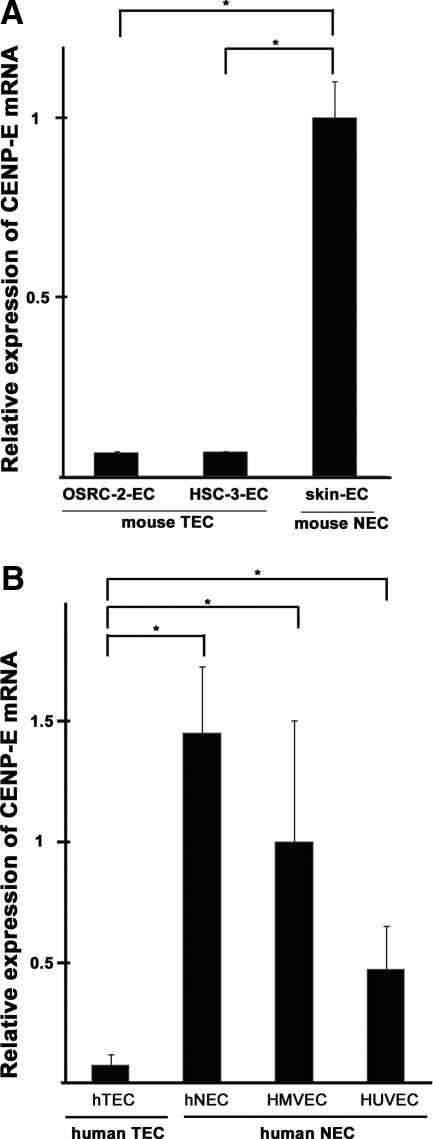
Figure 7.
Down-regulation of CENP-E expression in aneuploid TECs. A: CENP-E mRNA expression levels were compared between mTECs and mNECs by quantitative RT-PCR. CENP-E expression was significantly lower in mouse TECs (both OSRC-2-ECs and HSC-3-ECs) compared with mNECs (skin ECs) (∗P < 0.05, †P < 0.05). B: CENP-E mRNA levels in isolated hTECs, hNECs, human microvascular ECs (HMVECs), and HUVECs. Compared with all human NECs (hNECs, HMVECs, and HUVECs), hTECs expressed significantly lower levels of CENP-E (∗P < 0.05).

