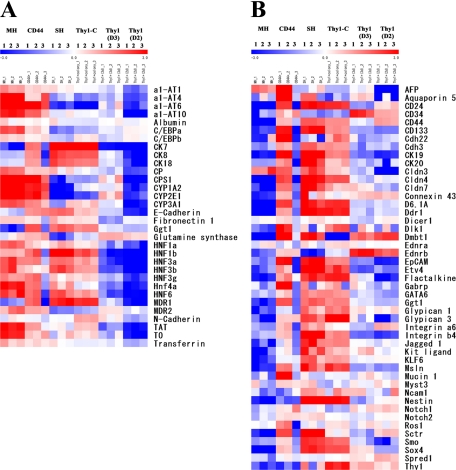
Figure 6.
Gene expression of sorted Thy1+ cells, CD44+ cells, and cultured Thy1+ cells. The gene expression pattern of sorted Thy1+ (GalN-D3) cells, Thy1+ cell-forming colonies (Thy1-C; GalN-D3), and CD44+ (GalN-D4) cells was analyzed by GeneChip (Affymetrix, Inc). Ten-day-cultured SH colonies and MHs isolated from a normal adult rat liver were used as controls. A heat map for genes that are classified into hepatic markers (A) and stem cell markers and hepatic stem/progenitor cell markers (B). Relative expression of genes in each cell type is shown in log2 scale. Increases in the mRNA level are represented as shades of red and decreases in shades of blue.

