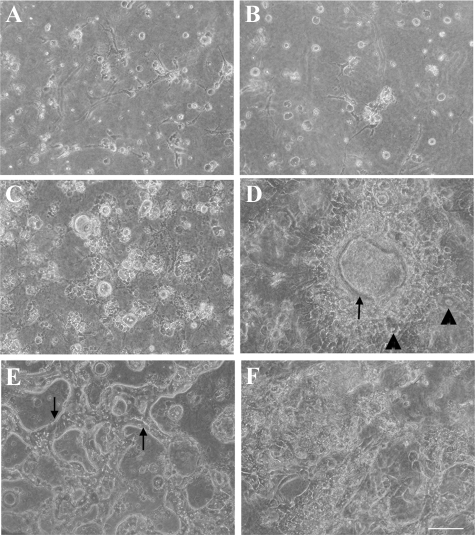
Figure 7.
Phase-contrast photos of sorted cells cultured between collagen gels. Thy1+ (GalN-D2) cells (A and B), Thy1+ (GalN-D3) cells (C and D), and CD44+ cells (E and F) were plated on collagen gel and covered with collagen gel. The cells were cultured in control medium (A, C, E) or in modified DMEM (Dex−/HGF+; B, D, F). The arrow and arrowheads in D show a cyst-like structure and cells with a large cytoplasm that are morphologically similar to MHs, respectively. E: Cells with a large cytoplasm form trabecules (arrows). Scale bar = 70 μm.

