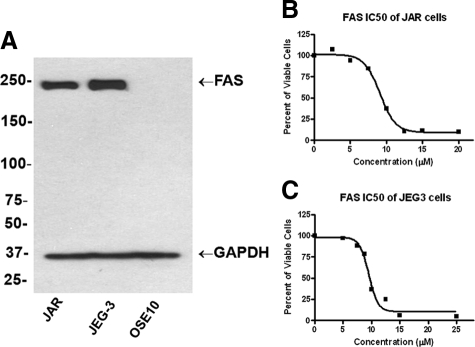
Figure 4.
Expression of FASN and growth inhibition by C93 in choriocarcinoma cell lines. A: Western blot analysis shows a single protein band with a molecular mass (∼230 kDa) corresponding to FASN protein, in both JAR and JEG3 cells, but not in the negative control, OSE-10, established from ovarian surface epithelium. B and C: The IC50 curves demonstrate a C93 dose-dependent growth inhibition in JAR and JEG3 cells.

