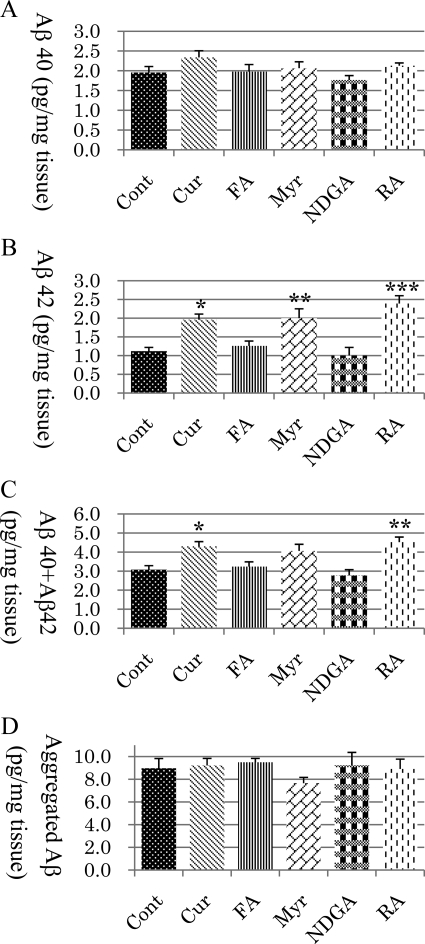
Figure 5.
Assessment of Aβ40 (A), Aβ42 (B), Aβ40 + Aβ42 (C), and aggregated Aβ (D) concentrations in the TBS-soluble fraction of mice brain tissue. There was no significant difference between the control and treatment groups in Aβ40 (A) and aggregated Aβ (D). Compared with the control, Aβ42 was significantly increased in the Cur (P < 0.05), Myr (P < 0.01), and RA (P < 0.001) groups (B), and Aβ40 + Aβ42 was also significantly increased in the Cur (P < 0.05) and RA groups (P < 0.01) (C). ∗P < 0.05; ∗∗P < 0.01; ∗∗∗P < 0.001.

