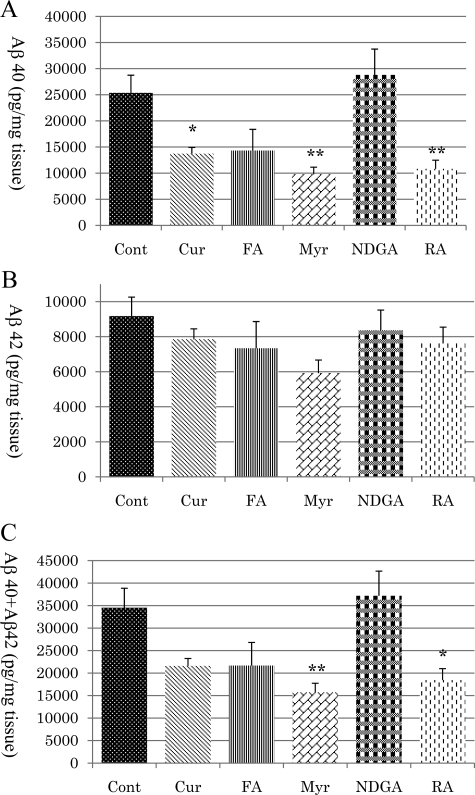
Figure 6.
Assessment of Aβ40 (A), Aβ42 (B), and Aβ40 + Aβ42 (C) concentrations in the TBS-insoluble fraction of mice brain tissue. Compared with the control, Aβ40 was significantly reduced in the Cur (P < 0.05), Myr (P < 0.01), and RA (P < 0.01) groups (A), and Aβ40 + Aβ42 was also significantly reduced in the Myr (P < 0.01) and RA (P < 0.05) groups (C). There was no significant difference between the treatment and control groups for Aβ42 (B). ∗P < 0.05; ∗∗P < 0.01.

