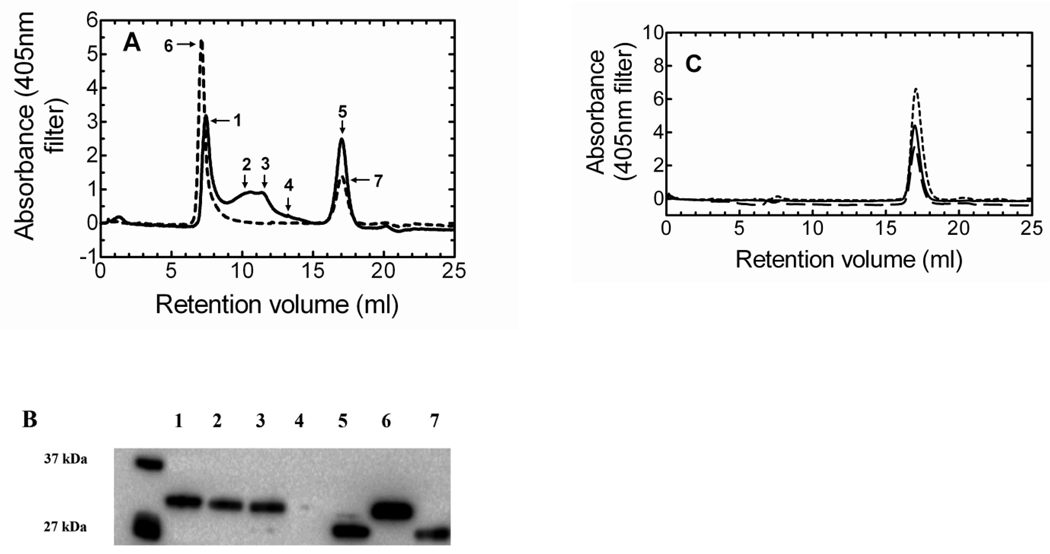
Figure 1. Gel filtration and Western blot analysis demonstrating the formation of high molecular weight HO-1 complexes.
A, The size exclusion chromatogram shows HO-1 complex formation following: no incubation without DLPC (———); and 2hr incubation with DLPC (- - - - -). B, Western blot of the peaks following gel filtration of HO-1 displayed the HO-1 in the earlier fractions (lanes 1–3) and a truncated HO-1 in the later fraction (lane 5). Following the 2hr incubation of HO-1 in DLPC only two peaks were observed. The first peak (lane 6) contained only HO-1, whereas the later fraction consisted of truncated HO-1 (lane 7). The unmarked lane served as molecular weight markers. C, sHO-1 size exclusion gel filtration: no incubation (———), sHO-1 and DLPC no incubation (— — —), and sHO-1 and DLPC 2hr incubation (- - - - -).

