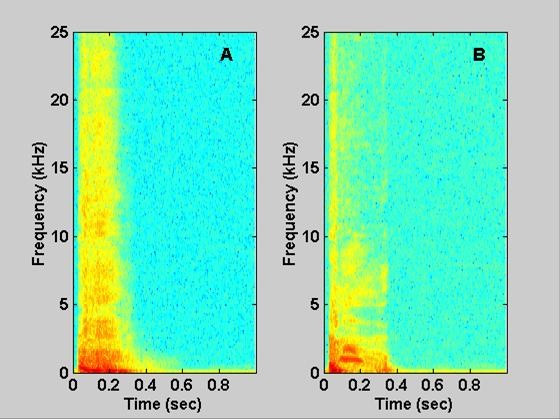
Figure 3.

Spectrograms of sound signals for voluntary coughs. A shows the joint time-frequency relationship from the normal cough shown in Figure 2A. B shows the relationship from the abnormal cough shown in Figure 2C. Note: the highest intensity is represented by red then yellow and is dark blue at its lowest values.
