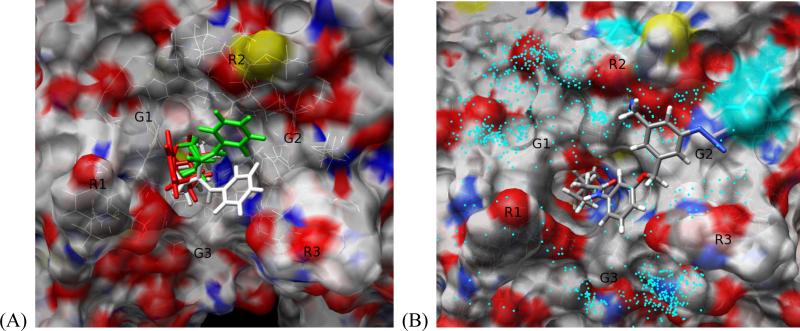
Figure 9.
(A) Binding mode 1, 2 and 3 of SAHA indicated in white, green and red, respectively. The surface is colored according to atom types using standard atom color convention. (B) The residues Asp233 and Asp272 modified by photoactivation of the probe 3 are marked by a cyan surface. The locations of the aromatic azide throughout the simulations are projected on the surface and are marked by cyan dots. Probe 3 is represented in a binding mode similar to the binding mode 2 observed for SAHA. G1-G3 and R1-R3 are grooves and ridges on the protein surface, respectively.

