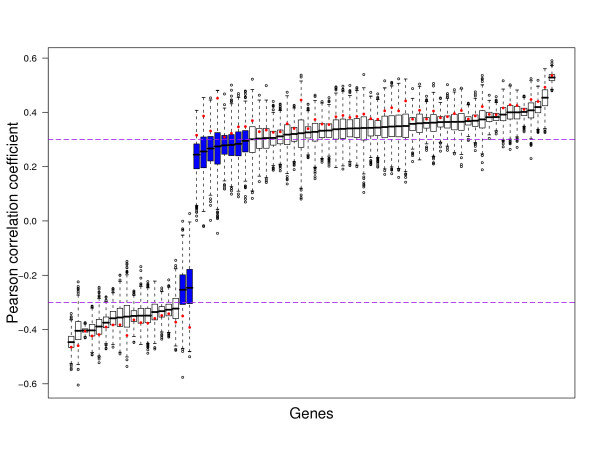
Figure 2.
Impact of perturbation variability on feature selection criterion of 70-gene signature. Distributions are shown of the feature ranking criterion (Pearson correlation) calculated over 1000 perturbations of the 78 training samples of the Van 't Veer dataset. The dashed purple lines indicate the used absolute threshold of 0.3. Blue boxes indicate genes that do not meet this filter criterion in more than 50% of the perturbations. The red dots indicate the correlations obtained using the unperturbed expression values.

