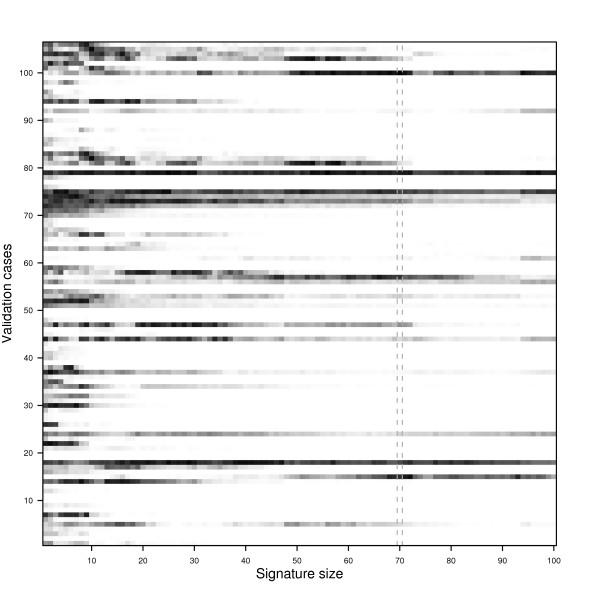
Figure 6.
A map-matrix example for the Rosetta dataset. The minimum assignment percentages (white = 0%, black = 50%) for the 106 validation samples and signatures of increasing size, determined over 1000 perturbations of the validation data. The column indicated by the dashed lines corresponds to the original 70-gene signature.

