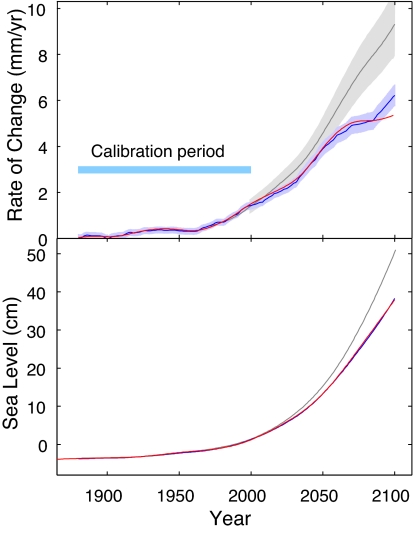
Fig. 1.
The 21st-century simulation. (Upper) The rate of sea-level rise from a climate model simulation (red) compared with that predicted by Eq. 1 (gray) and Eq. 2 (blue) based on global mean temperature from the climate model. Shaded areas show the uncertainty of the fit (1 SD). The parameter calibration period is 1880–2000, and 2000–2100 is the validation period. (Lower) The integral of the curves in Upper, i.e., sea-level proper.

