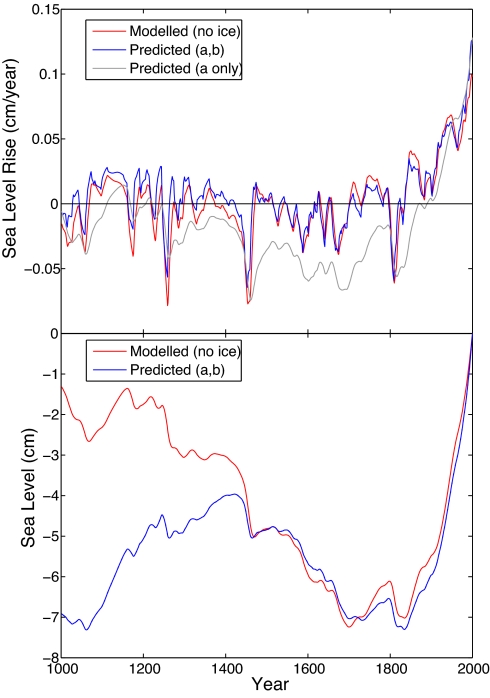
Fig. 2.
The millennnium simulation. (Upper) Rate of sea-level rise for the last millennium from a climate model simulation (red), compared with that predicted by Eq. 1 (gray) and Eq. 2 (blue) based on global mean temperature from the climate model. Note that parameter calibration was done for the model simulation shown in Fig. 1 for 1880–2000 only (but see below for T0). (Lower) Sea level for the last millennium, obtained by integration. A correction to the T0 parameter of −0.13 K (corresponding to a constant sea-level trend of a·T0 = −0.1 mm/year) was applied to make the long-term sea-level trends match better after the year 1400.

