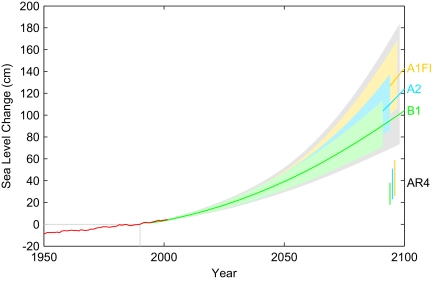
Fig. 6.
Projection of sea-level rise from 1990 to 2100, based on IPCC temperature projections for three different emission scenarios (labeled on right, see Projections of Future Sea Level for explanation of uncertainty ranges). The sea-level range projected in the IPCC AR4 (2) for these scenarios is shown for comparison in the bars on the bottom right. Also shown is the observations-based annual global sea-level data (18) (red) including artificial reservoir correction (22).

