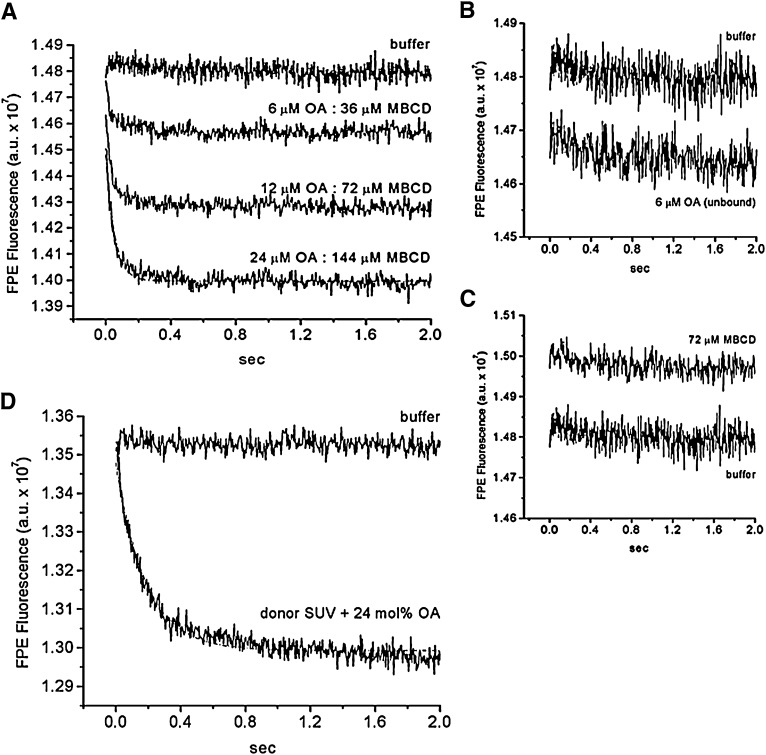
Fig. 4.
The kinetics of OA transfer from MBCD to lipid vesicles (SUV) measured with FPE. A suspension of SUV labeled with FPE (100 μM egg-PC + 1 mol% FPE) was rapidly mixed with increasing amounts of OA:MBCD complexes at a fixed molar ratio of 1OA:6MBCD (A). The final concentration of OA:MBCD complexes were 6 μM OA:36 μM MBCD, 12 μM OA:72 μM MBCD, and 24 μM OA:144 μM MBCD. The curve with 24 µM OA:144 µM MBCD was fitted to one phase exponential decay with a t1/2 of ∼30 ms (dashed line). As a control, the same SUV preparation was mixed with 6 μM unbound OA (B) and with MBCD not complexed with OA (empty MBCD; 72 μM CD) (C). A different SUV preparation also labeled with FPE (100 µM egg-PC + 1mol% FPE) was mixed with FA donor SUV (300 µM egg-PC) containing 24 mol% OA (D). The curve shown in D was fitted to one phase exponential decay with t1/2 of 128 ms (dashed line). SUV mixed with buffer served as a mixing control. Each fluorescence trace is the average of 5 to 10 measurements and represents one experiment.

