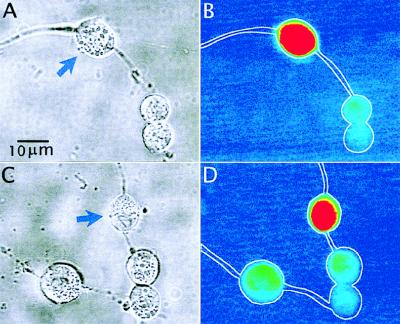
Figure 2.
Photomicrographs demonstrating electroporation of single progenitor cells from the adult rat brain to incorporate fluorescein (10 μM). (A and C) Bright-field images of small groups of progenitor cells in which one was electroporated (arrow). The cells were electroporated with 10 pulses of ≈1 V at 0.5-Hz repetition rate. The false-color coded fluorescence images (fluorescence intensity proportional to color wavelength) of the respective images are shown in B and D. The fluorescence from fluorescein is localized preferentially to the electroporated cells. The fluorescence intensity (measured as pixel intensity per square micrometer over the total cross sectional area of a single cell at the same laser intensity and detector settings) of electroporated cells (n = 10) was 4.3-fold higher (P < 0.001, using an unpaired one-tailed Student’s t test) than the background fluorescence intensity from untreated cells (n = 6).

