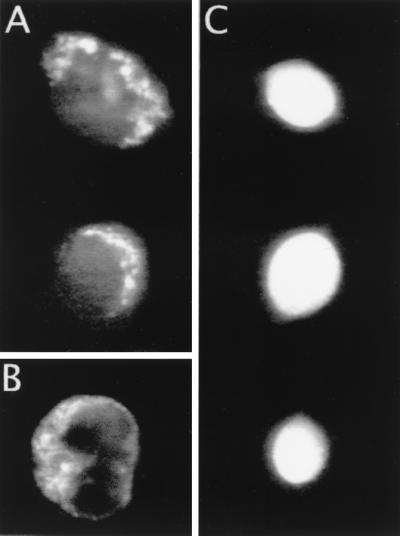
Figure 3.

Photomicrographs demonstrating differential fluorescence staining resulting from electroporation of fluorescein into single progenitor cells at high and low electric field strengths, respectively. (A) Two cells electroporated at plasma membrane superthreshold potentials of ≈2 V (10 pulses at 0.5-Hz repetition rate), both of which display a punctuate cytoplasmic fluorescence pattern. (B) Single progenitor cell after incubation with rhodamine 123, a mitochondria-specific dye. (C) Images of three cells after electroporation at the plasma membrane threshold potential of ≈1 V (10 pulses at 0.5-Hz repetition rate) in which the fluorescence is diffuse and evenly distributed over the entire cell.
