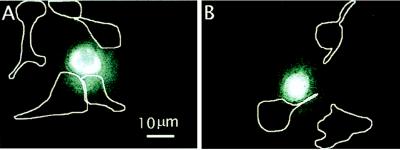
Figure 5.
Fluorescence images demonstrating selective transfection of single COS 7 cells with the pRAY 1 expression vector containing the cDNA for green fluorescent protein. The images were taken 36 hours after electroporation. Control cells exposed to plasmid but not electroporated are outlined with white contour lines. The location of control cells was identified from bright-field images and superimposed onto the fluorescence images.

