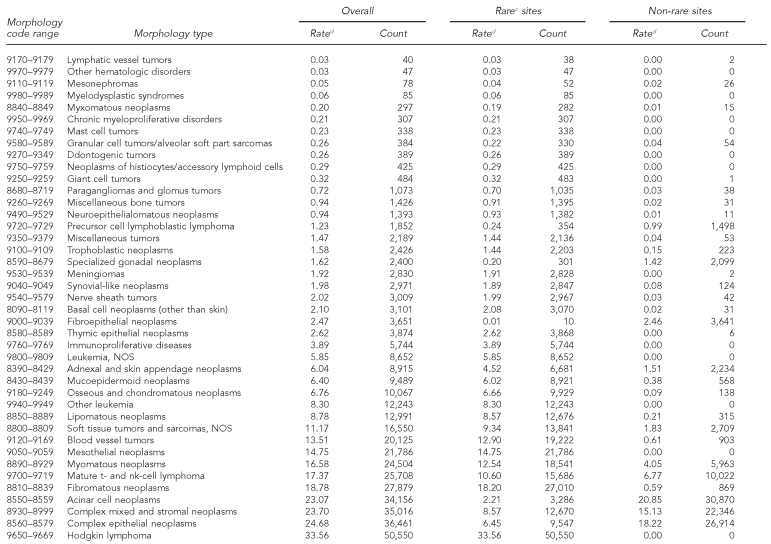
Table 2.
Cancer incidence by histologic groupinga among rare and non-rare cancer sites:b adults, 41 U.S. registries combined, 1995–2004
Source: North American Association of Central Cancer Registries file submission as of December 2006 from: Alabama, Alaska, Arizona, California, Colorado, Connecticut, Delaware, Washington, D.C., Florida, Georgia, Hawaii, Idaho, Illinois, Indiana, Iowa, Kentucky, Louisiana, Maine, Massachusetts, Detroit, Missouri, Montana, Nebraska, Nevada, New Hampshire, New Jersey, New Mexico, New York, North Dakota, Oklahoma, Oregon, Pennsylvania, Rhode Island, South Carolina, South Dakota, Texas, Utah, Washington, West Virginia, Wisconsin, and Wyoming
aHistology classification using groupings shown in: Fritz A, Percy C, Jack A, Shanmugaratnam K, Sobin L, Parkin DM, et al., editors. International classification of diseases for oncology. 3rd ed. Geneva: World Health Organization; 2000.
bClassification by SEER site recode: Ries LAG, Melbert D, Krapcho M, Mariotto A, Miller BA, Feuer EJ, et al., editors. SEER Cancer Statistics Review, 1975–2004. Bethesda (MD): National Cancer Institute; 2007. Also available from: URL: http://seer.cancer.gov/csr/1975_2004 [cited 2008 Sep 25].
cCancers occurring at rare sites with an incidence rate of <150 per million per year
dRates are invasive, microscopically confirmed cancers per million per year and age-adjusted to the 2000 U.S. Standard Population (Census P25-1130).
NOS = not otherwise specified


