
Figure 2.
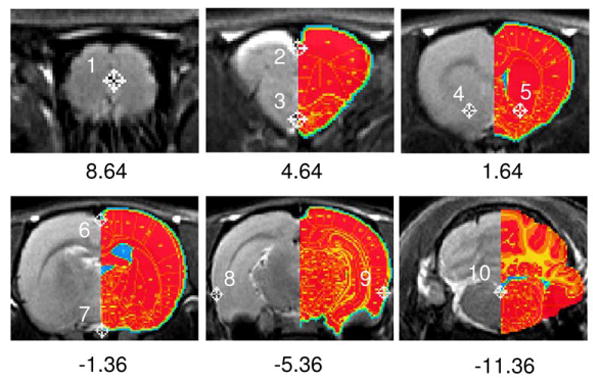
Rat coronal slices showing tag locations with the Paxinos rat atlas superimposed on the right half of each slice. Number below each figure indicates distance relative to bregma. The top-left image (slice 3/23) is centered at bregma +8.64 mm, where there is no standard rat atlas at this location, and therefore no atlas is overlaid.