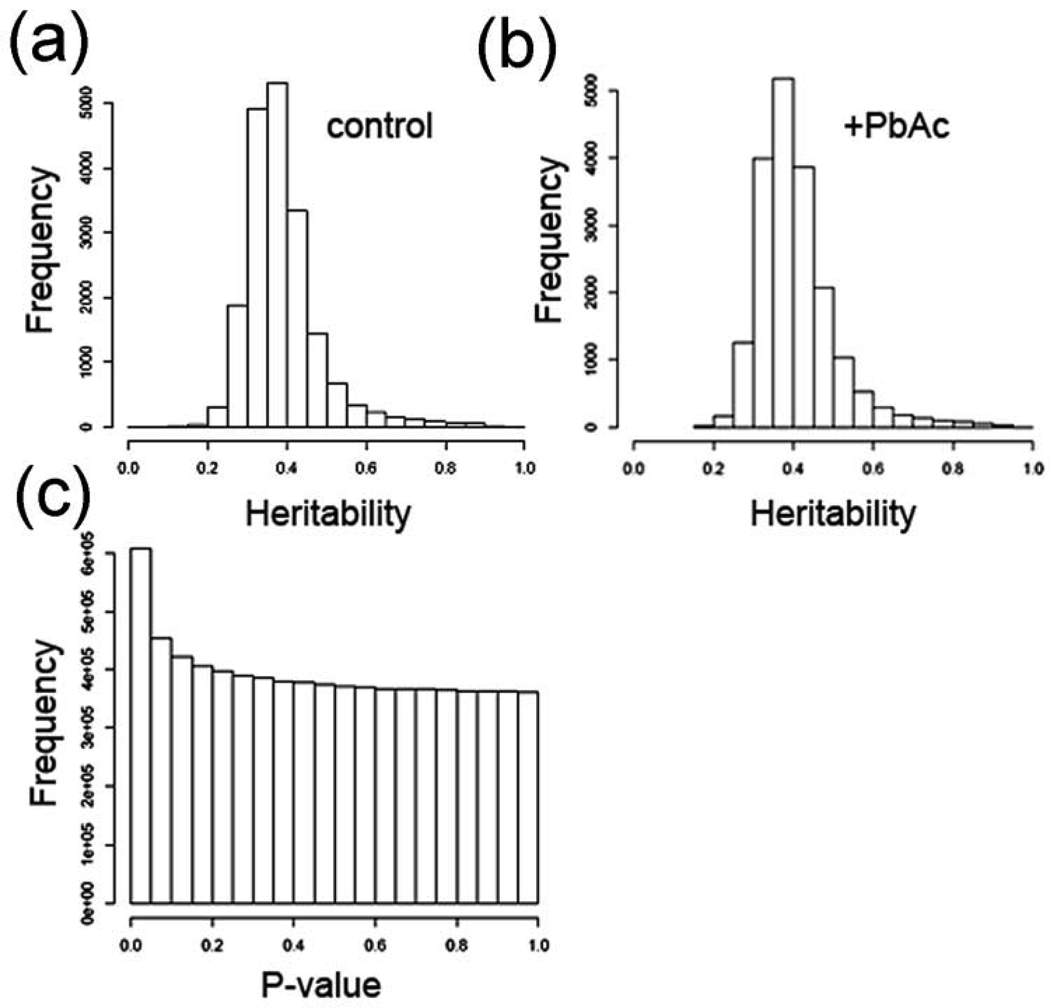
Figure 2. Heritability and P values for eQTL data.
(a) Heritability estimates without factoring in treatment (environment) effects. (b) Heritability estimates with treatment effects factored in. c, P values for all markers (82 markers), and every 5 cM between markers by all expression traits. As can be seen there are more ‘significant’ (P < 0.05) than expected at random.

