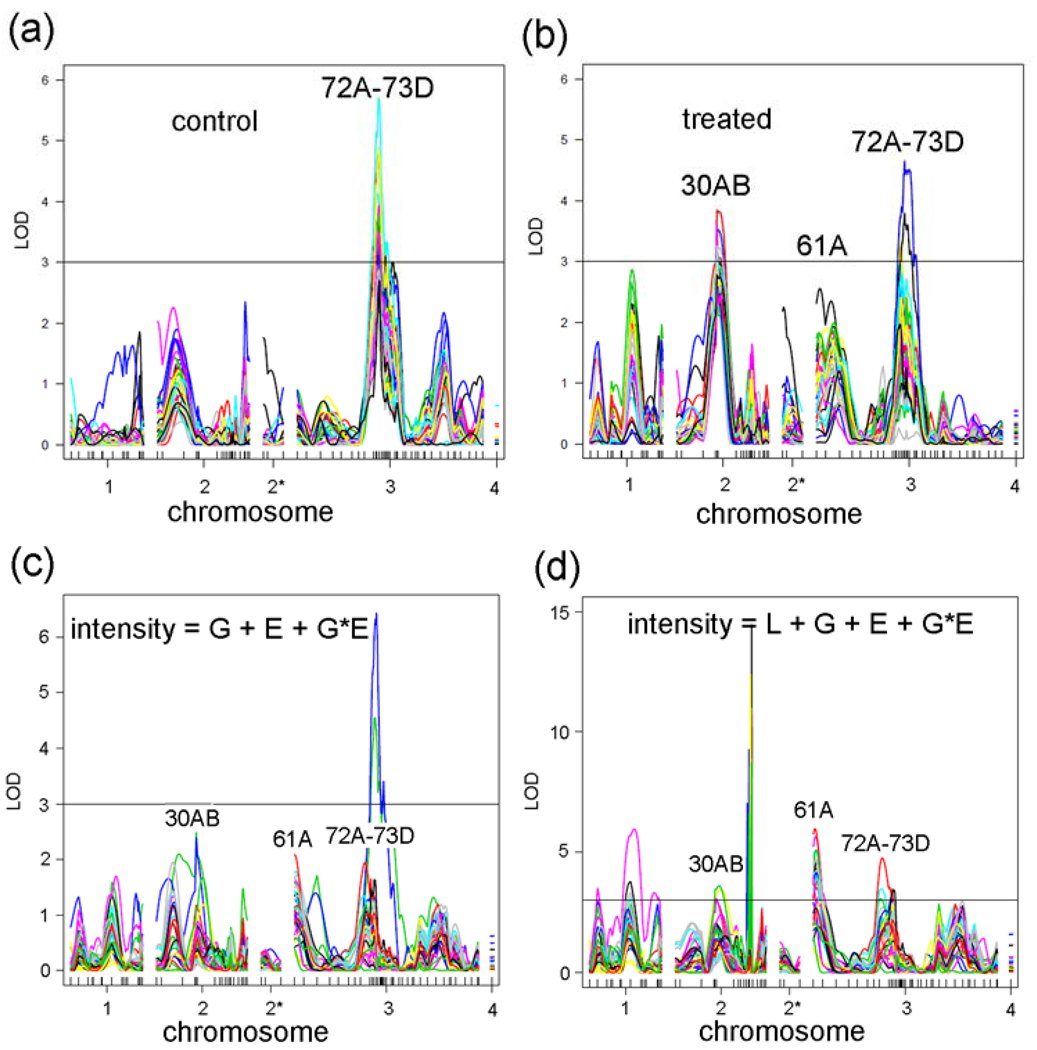
Figure 7. QTL analyses of 33 genes co-regulated by two loci.
(a) eQTL graphs of 33 genes in control flies. (b) eQTL graphs of 33 genes in treated flies. (c) GxE graphs of 33 genes where Line (L) is not an independent covariate (intensity = G + E + GXE + error). (d) GxE graphs of 33 genes with the full model (intensity = L + G + E + GXE + error). Notice that more genes cross the LOD = 3 line at 30AB, 61A, and 72A–73D in the full model compared with c.

