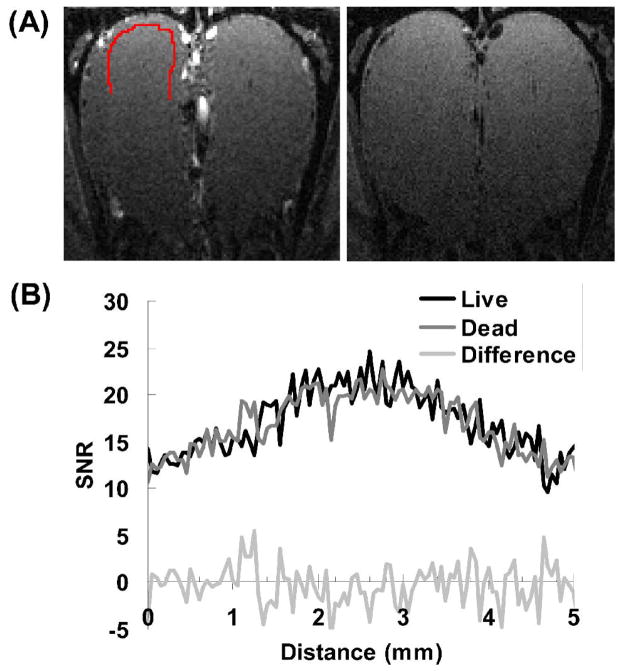
Fig. 2.
(A) T1-weighted images of a rat before (left) and after (right) euthanasia. (B) The SNR profiles along the glomerular layer (indicated as the red curve in (A)) are similar between live (black line) and dead (gray line). Without Mn2+ enhancement, no distinguishable structure can be found in the difference between the two profiles (light gray line).

