
Fig. 6.
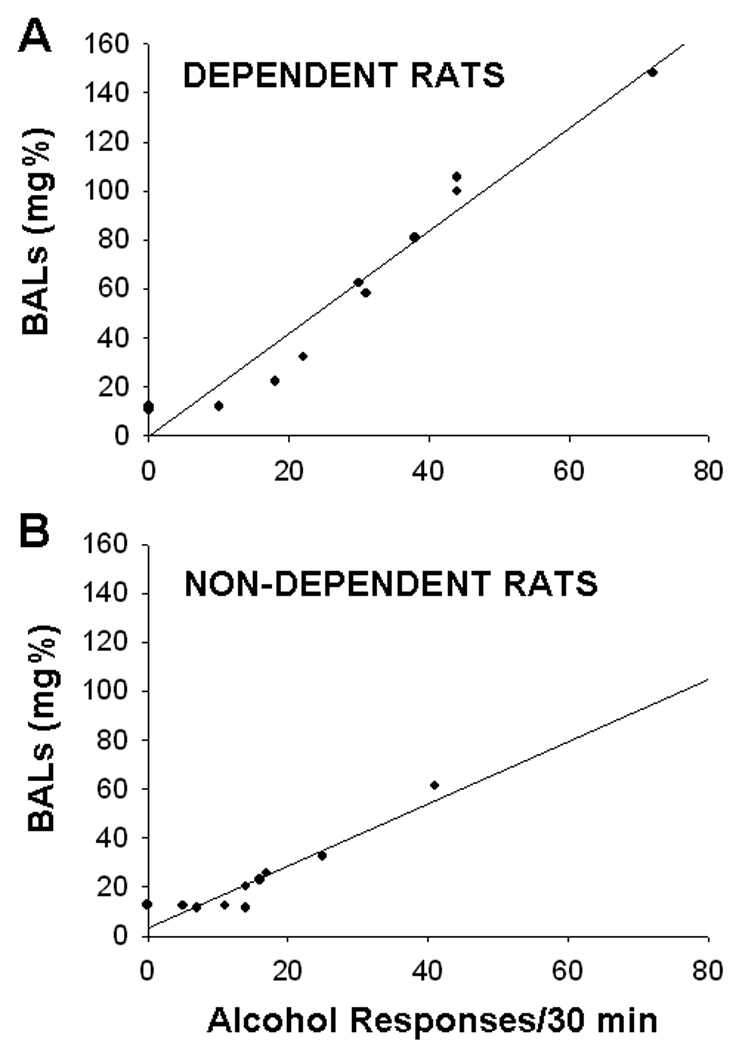
Scatter plot of operant responses for 10% w/v alcohol and resultant BALs for (A) dependent and (B) non-dependent rats during the 30-min test session that occurred 4 hrs into withdrawal from alcohol-liquid diet. The scatter plot for the 4-hr time point is representative of scatter plots at the 2-hr and 6-hr time points. Operant alcohol responses were significantly correlated with BALs at all three time points (see text)