
Figure 2.
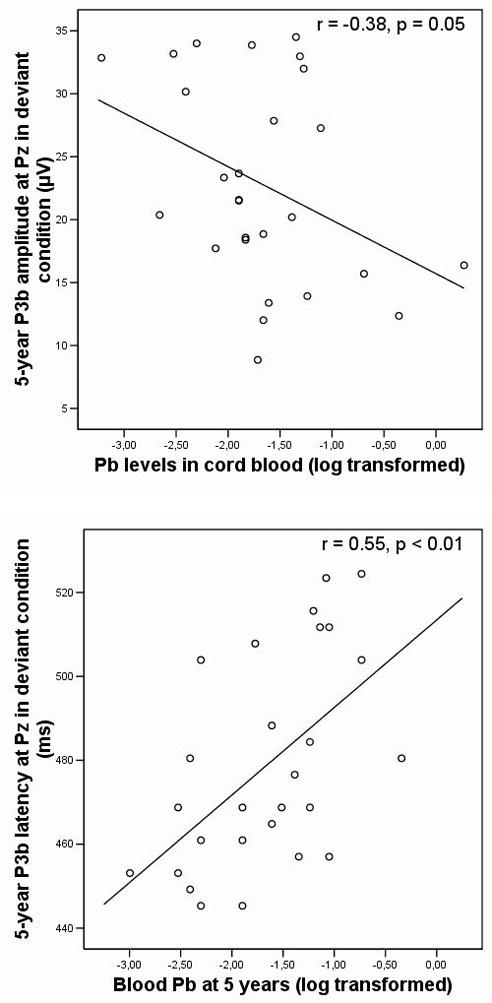
Scatterplots showing the relationships between Pb levels and P3b parameters at 5 years of age (N = 27). Dots represent individual values. Both graphs suggest the Pb-P3b relationship is linear.
Official websites use .gov
A
.gov website belongs to an official
government organization in the United States.
Secure .gov websites use HTTPS
A lock (
) or https:// means you've safely
connected to the .gov website. Share sensitive
information only on official, secure websites.
Scatterplots showing the relationships between Pb levels and P3b parameters at 5 years of age (N = 27). Dots represent individual values. Both graphs suggest the Pb-P3b relationship is linear.