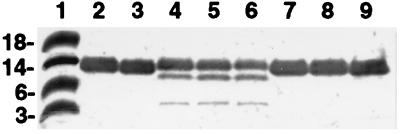
Figure 2.
Gel electrophoresis pattern of Lyso under various conditions. Lane 1, molecular weight markers; lane 2, Lyso (15 μM); lane 3, Lyso (15 μM), Py-Phe (15 μM), and CoHA (1 mM), dark control; lanes 4–6, same as lane 3 but after 5, 10, and 20 min of irradiation at 344 nm, respectively; lane 7, Lyso (15 μM) after irradiation for 20 min; lane 8, Lyso (15 μM) and Py-Phe (15 μM), after irradiation for 20 min; lane 9, Lyso (15 μM) and CoHA (1 mM) after irradiation for 20 min. The samples were run top to bottom and the new bands in lanes 4, 5, and 6 correspond to the lower molecular weight fragments.

