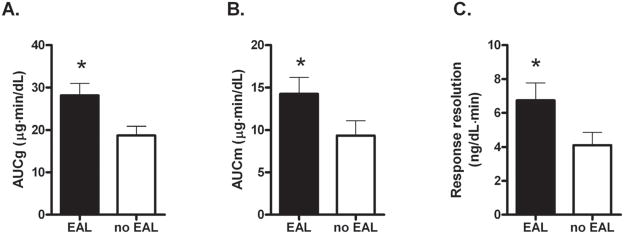
Figure 2.
Summary measures of cortisol response. The AUCg (A) is the area under the curve to the x-axis, and the AUCm (B) is the area under the curve to a horizontal line at the minimum value for that subject. The response resolution rate (C) is the decrease in cortisol from peak to baseline after the stressor divided by the time elapsed between the two points. All measures are greater in individuals with EAL (p < 0.05).

