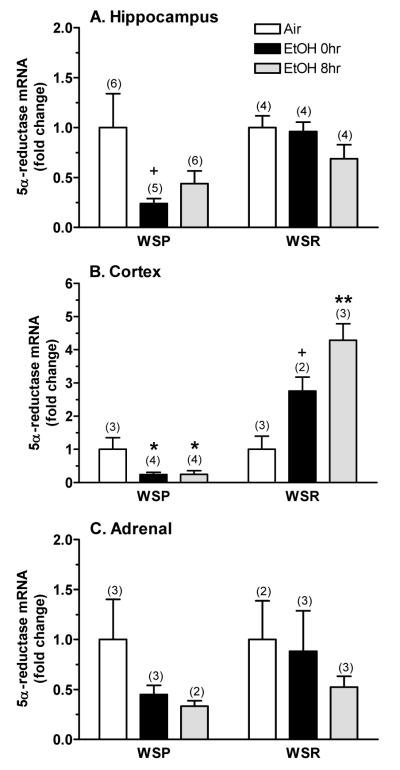
Figure 3. Chronic ethanol exposure and withdrawal differentially altered expression of the 5α-reductase-1 transcript in (A) hippocampus, (B) cortex, and (C) adrenals from WSP and WSR mice.
Real-time qRT-PCR was conducted in dissected tissues. The fold-change in expression vs. respective air control mice is depicted. The y-axis for panel B differs from that shown in the other 2 panels. Values represent the mean ± SEM for the number of animals in parentheses. Assays were conducted in duplicate with similar values to those in the figure. +P ≤ 0.10, *P < 0.05, **P < 0.01 vs. respective air control, Tukey’s post-hoc test

