
Figure 6. Glutamate C4 and C3 time courses and fits.
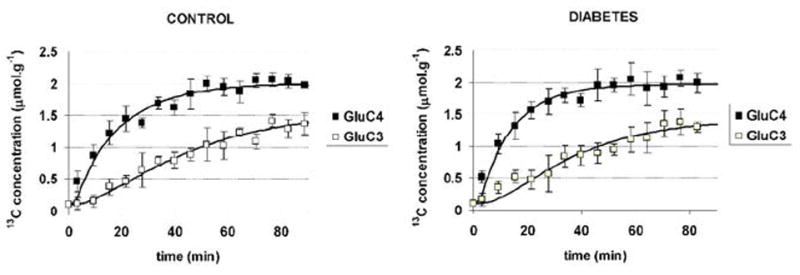
Experimental data for glutamate C4 (filled squares) and glutamate C3 (open squares) in control subjects (left) and in subjects with type 1 diabetes (right). Time courses of 13C label incorporation were very similar in both groups. Best fits of the metabolic model to the data are shown as continuous lines. Values of metabolic rates VTCA and VX corresponding to the best fits are given in Table 1.