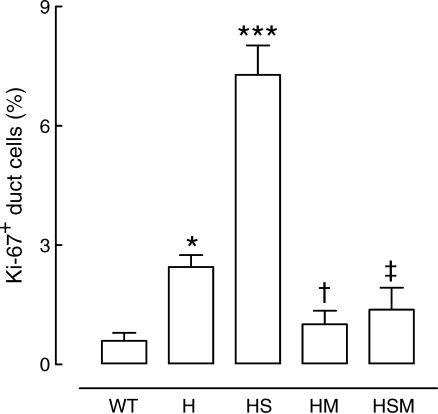
Fig. 2.
Quantification of ductal cell replication in wild-type (WT) and HIP (H) rats, and in HIP rats treated with sitagliptin (HS), metformin (HM) or a combination of both (HSM) for 12 weeks. *p < 0.05 for H vs WT; ***p < 0.001 for HS vs all groups; †p < 0.05 for HM vs H and HS; ‡p < 0.001 for HSM vs HS. (Reprinted with permission of the American Diabetes Association, Inc., © 2009 from Matveyenko et al. [11])

