
Figure 1. Models of progressing to a pluripotent state during direct reprogramming.
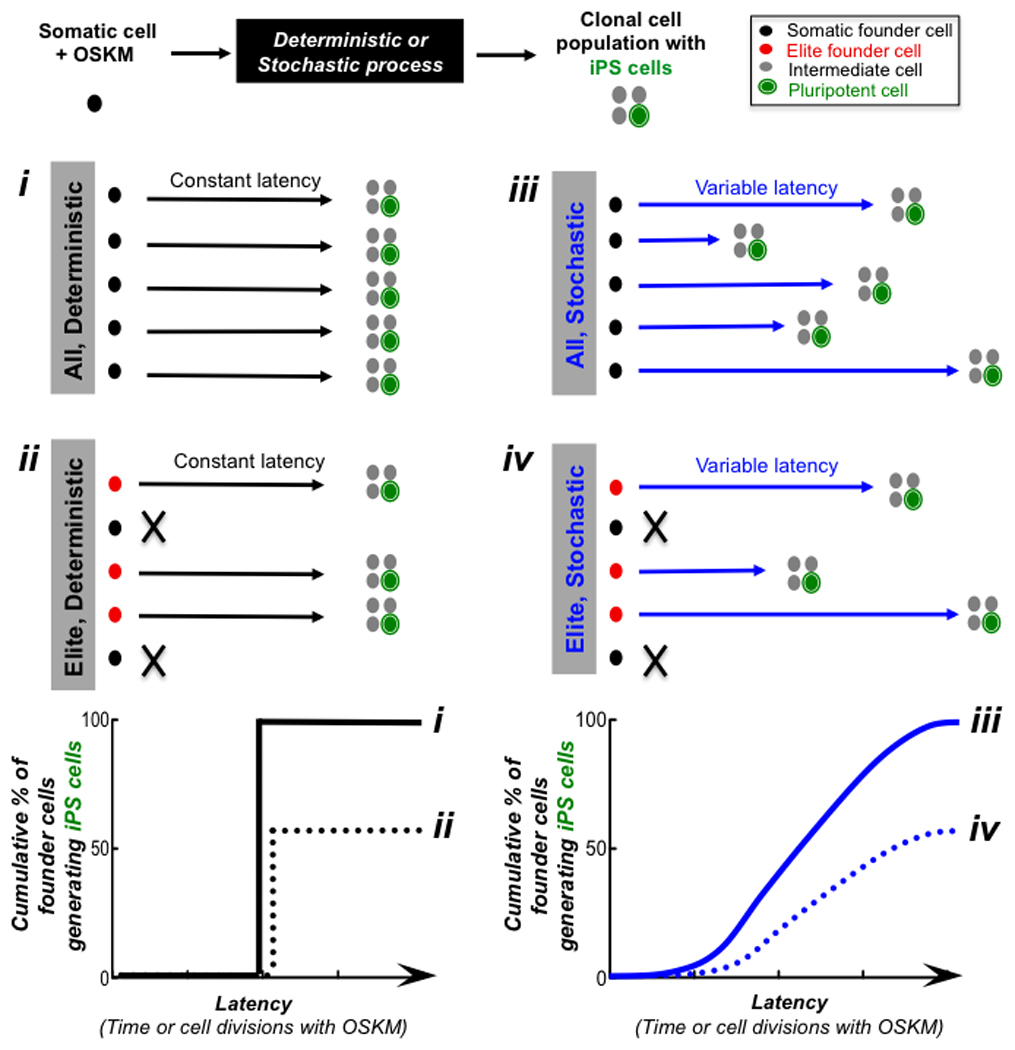
Four different models (i–iv) to account for the latency of donor somatic cells in progressing towards the induced pluripotent stem cell (iPSC) state following the expression of OSKM reprogramming factors. Latency can be measured in units of absolute time or cell divisions until the first iPSC is generated from a monoclonal population. Graphs display the general shape of the reprogramming kinetics in the different scenarios. Note that elite models do not necessarily reprogram more slowly as shown in the bottom plots.