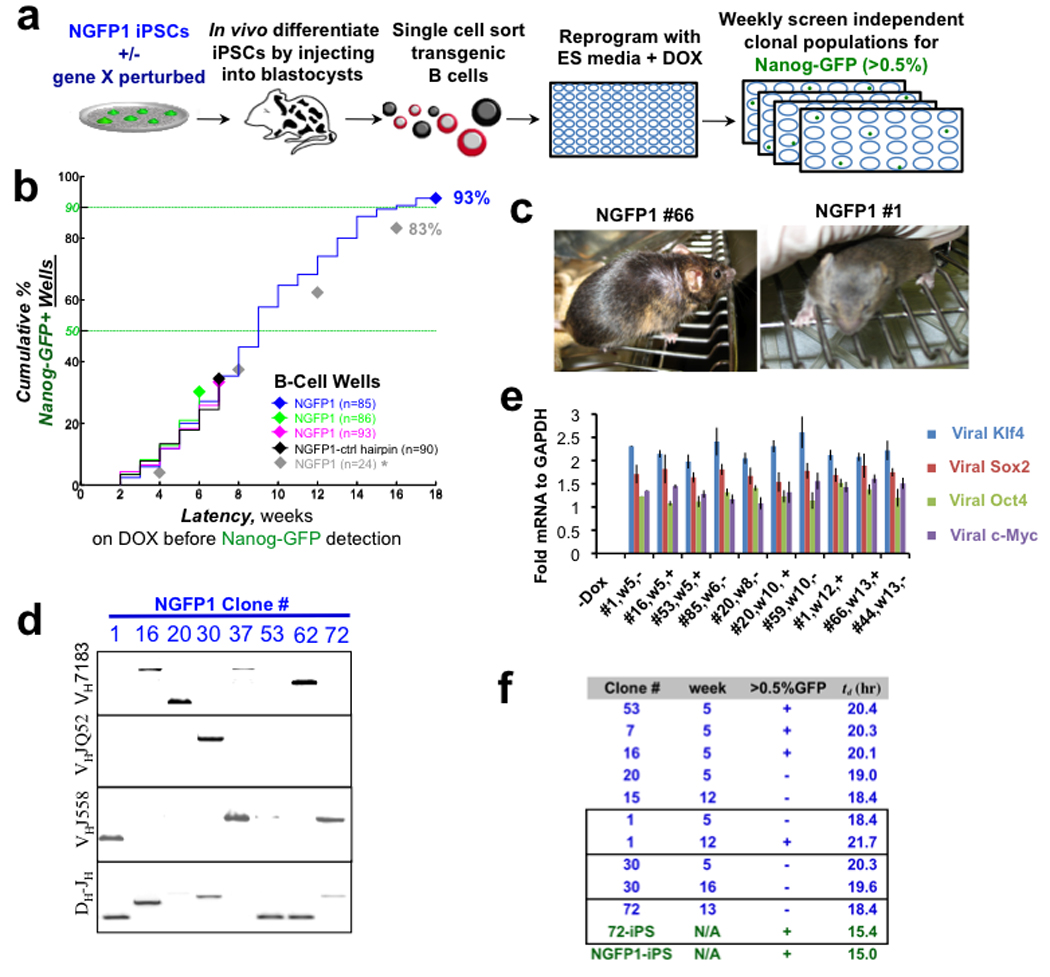
Figure 2. Long-term analysis of reprogramming monoclonal populations.

a, Schematic of experiments. b, Reprogramming of Pre-B cell monoclonal populations measured as the cumulative number of wells that became Nanog-GFP+. n indicates number of populations monitored. Asterisk indicates flow cytometry for GFP detection was performed every 4 weeks. c, Chimeric mice with agouti coat color from iPSCs derived after 12–13 weeks of DOX. d, Heavy chain rearrangements in iPSCs. e, Relative transgene induction levels of monoclonal populations on DOX. Error bars indicate standard deviation (n=3). f, The population averaged doubling time, td, for each clonal population. Boxes delineate cases where the same clonal population was measured at different times during DOX induction. Lower two lines (green) represent subcloned iPSC lines. Clone labeling: clone #, weeks on DOX (w#), Nanog-GFP >0.5% status (+/−).
