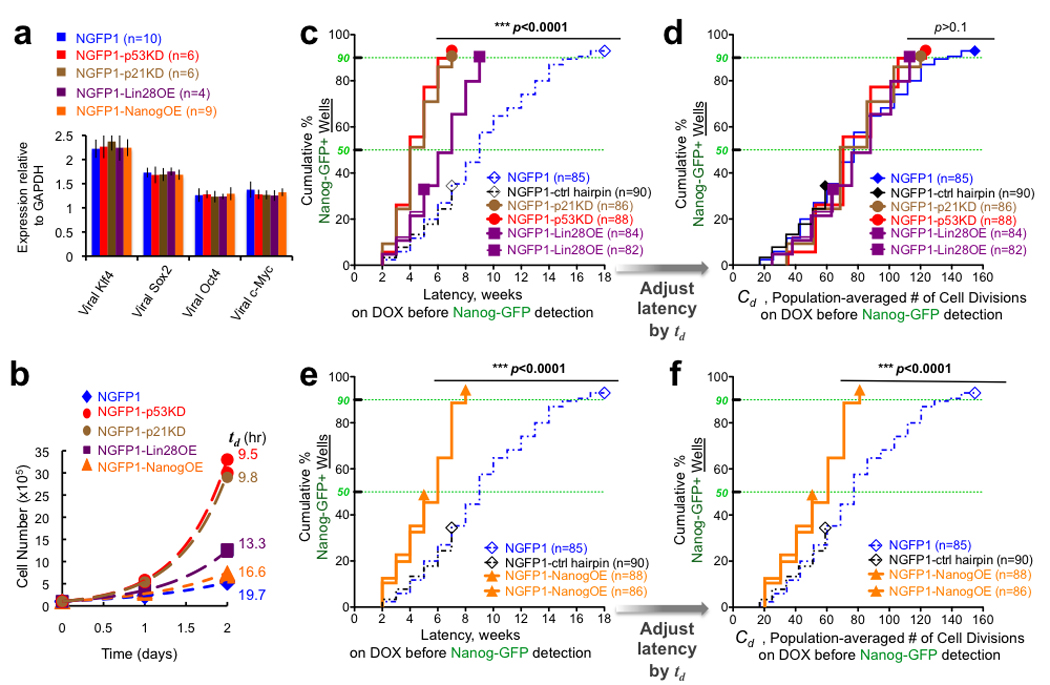
Figure 3. Cell division rate dependent and independent acceleration of reprogramming.

a, Average induction levels for transgenes in different NGFP1 cell populations. n indicates number of populations sampled per group, presented as mean ± s.d. b, Growth curves for cells on DOX. Exponential growth (dashed line) described the data well (R2=0.97–1.0), and the population-averaged doubling times (td) were calculated from these fits (Supplementary Fig. 9). c, As in Fig. 2b, latencies for reprogramming various clonal B cell derived populations. NGFP1-p53KD, NGFP1-p21KD, and NGFP1-Lin28OE wells were statistically distinct from the NGFP1 and NGFP1-control hairpin wells (p<0.0001, logrank test for dissimilarity). d, Rescaling time by td provides an estimate for the number of cell divisions occurring during latency. No statistical difference between groups was observed after rescaling time by td (p>0.1). e–f, As in c–d, but for NGFP1-NanogOE wells. n indicates number of populations monitored.
