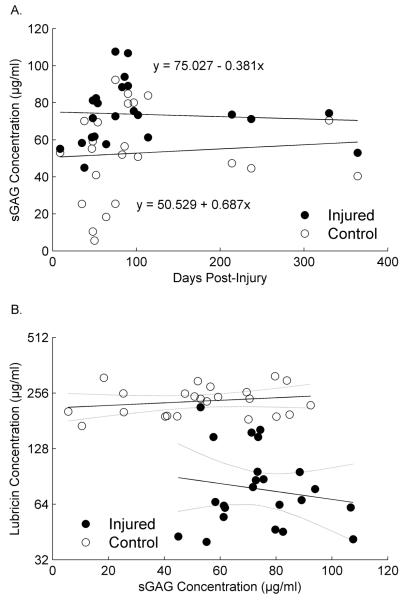
Fig. 5.
(A) Mean SF sGAG concentrations in injured and contralateral joints of patients following an isolated ACL injury. Error bars represent 1 standard deviation. *Indicates that SF sGAG concentrations were significantly (p=0.003) higher in injured joints compared to contralateral joints. (B) SF sGAG concentrations expressed as a function of time following ACL injury in both joints. The sGAG concentration did not change as a function of time in either knee.

