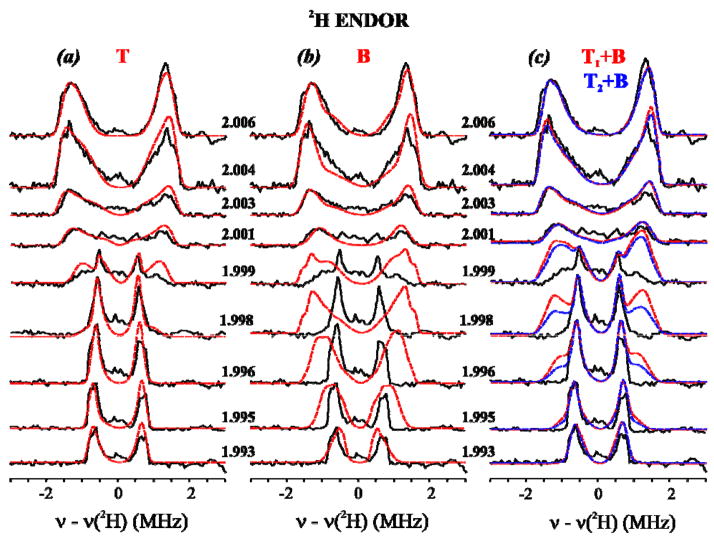
Fig 4.
Experimental 2-D field-frequency plots of Davies 2H ENDOR spectra of X(WT) in D2O. Red and blue curves are simulations with the three models considered here (Fig 1; see text and Table 1): (a) T; (b) B, (c) [TX+B], considered here. Conditions: π-pulse length = 200 ns, τ = 600 ns, repetition time = 50 ms, MW frequency = 34.826 GHz, T = 2 K. All spectra are centered at the 2H nuclear Larmor frequency. Backgrounds have been subtracted from experimental spectra as discussed (See Materials and Methods and Supplementary Materials.).
(a) Experiment with T proton simulations overlaid. Simulation parameters (determined as described in text): g = [g1 = 2.0056, g2 = 1.9977, g3 = 1.993], A = [A1 = −1.55, A2 = −1.15, A3 = 3.2] MHz (Euler angles α = 10.5°, β = 72°, γ = 0), line widths used = 0.09 (minimum) to 0.25 (maximum) MHz.
(b) Experiment with simulations of the B proton model, optimized by including aiso. Spin Hamiltonian parameters for the bridging hydroxide (optimized); g = [g1 = 2.0056, g2 = 1.9977, g3 = 1.993], A = [A1 = −3.031, A2 = −0.948, A3 = 3.179] MHz (Euler angles α = 0.0°, β = 115.0°, γ = 75.0°), linewidths range from 0.08 (minimum) to 0.25 (maximum) MHz.
(c) Experiment with simulations of [TX+B] models: x = 1 (red), x = 2 (blue). Parameters for the simulations of terminal and the optimized bridging hydroxides: see Figs 4A, 4B and Table 1. For x = 1, the intensities of the T and B deuteron signals were added and the resultant scaled to the maximum of the experiment; for x = 2, twice the T intensity was added to the B intensity before scaling.

