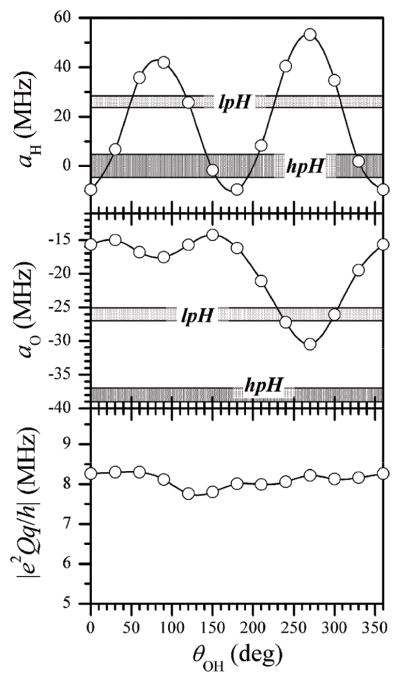
Fig. 10.
Hyperfine and quadrupole interaction parameters of 1H (top panel) and 17O (middle and bottom panels) of the OH ligand calculated by DFT as a function of the orientation of this ligand. Dark and light grey strips indicate the experimental values for hpH and lpH SOEs, respectively. For the 17O quadrupole coupling constant the experimental value is unavailable.

