
Fig. 9.
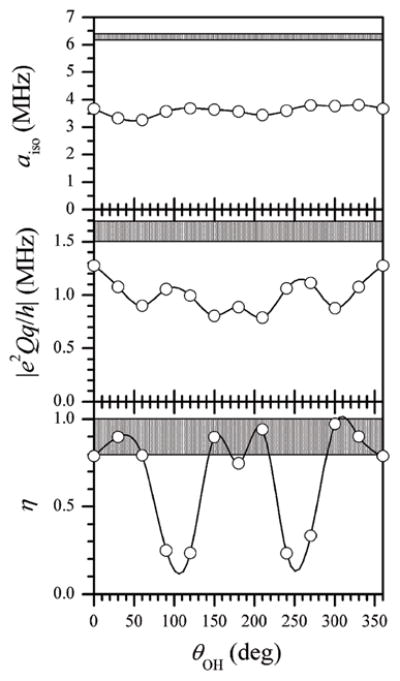
Hyperfine and quadrupole interaction parameters of the oxo-17O ligand calculated by DFT as a function of the orientation of the OH ligand. Grey strips correspond to the experimental values.
Official websites use .gov
A
.gov website belongs to an official
government organization in the United States.
Secure .gov websites use HTTPS
A lock (
) or https:// means you've safely
connected to the .gov website. Share sensitive
information only on official, secure websites.
Hyperfine and quadrupole interaction parameters of the oxo-17O ligand calculated by DFT as a function of the orientation of the OH ligand. Grey strips correspond to the experimental values.