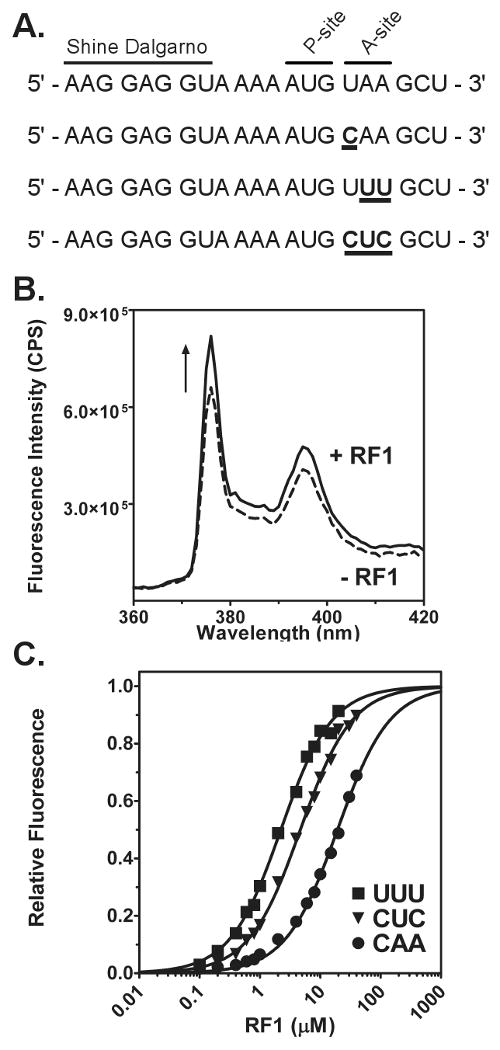
Figure 2. Fluorescence assay to monitor RF1 binding.

(A) Sequence of four model mRNAs used to measure RF1 binding to stop or sense codons. The Shine-Dalgarno sequence, P-site, and A-site codons are labeled. Changes from the UAA stop codon are shown in bold and underlined. (B) Increase in fluorescence intensity due to RF1 binding. Fluorescence emission scans before (dotted line) and after addition (black line) of RF1 to release complex with a UAA stop codon in the A site. (C) Examples of fluorescence titrations to determine the KD of RF1 for sense codons: UUU (square), CUC (triangle), and CAA (circle). Data were analyzed by fitting to a quadratic equation (black line) and normalized from zero to one based upon the best-fit line.
