
Figure 5.
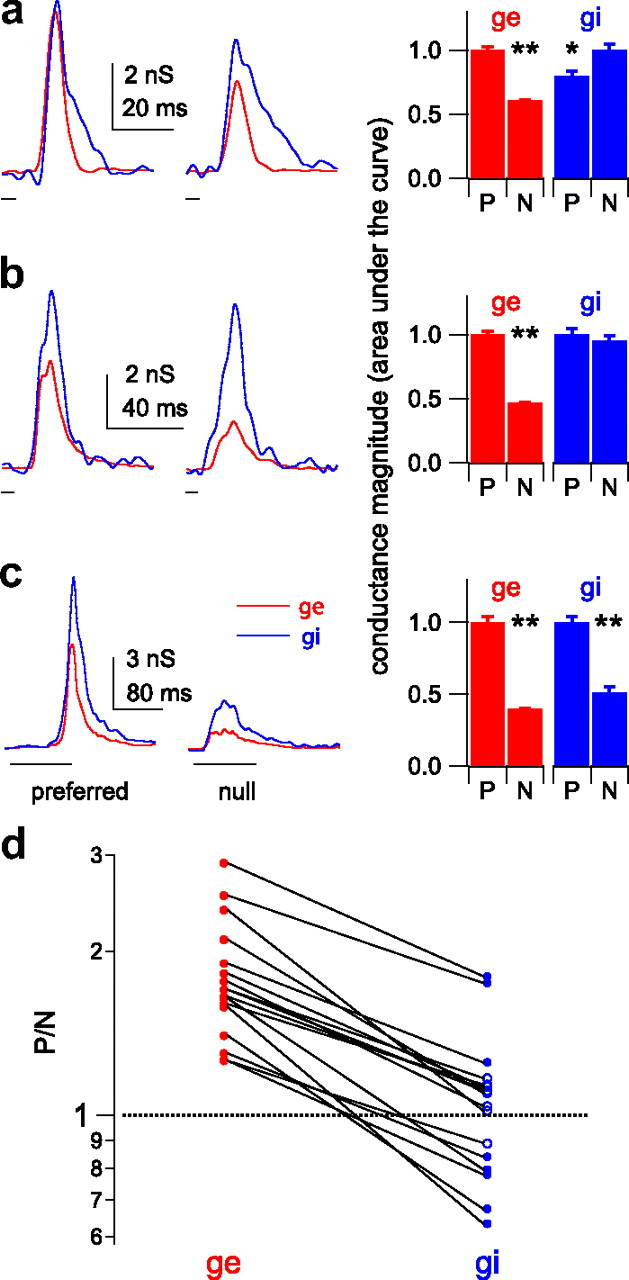
Input magnitude asymmetries show that the presynaptic cells were directionally selective. a–c, Input magnitude asymmetries of conductance sets for three cells. Left column, Preferred (left) and null (right) conductance traces, excitation (g e, red) and inhibition (g i, blue). Sweep timing shown below traces. Right, Total evoked conductance magnitudes (normalized areas under the curves; P, preferred, N, null). The preferred g e is significantly larger than the null g e in each set. a, Preferred inhibition is smaller than the null. b, Preferred and null inhibition are equal. c, Preferred inhibition is larger than the null (*p < 0.05, **p < 0.01, Student's t test). d, The P/N ratios for all 17 conductance sets. For excitation, all 17 P/N ratios were significantly greater than 1, indicating a magnitude asymmetry that favored the preferred sweep (filled red circles; mean of 1.79 ± 0.11). In contrast, the inhibitory P/N ratios varied at ∼1.0 (mean of 1.07 ± 0.08), and only eight were significantly different from 1 (filled blue circles). Five of 17 P/N ratios for inhibition were <1, favoring the preferred sweep. Nine of 17 were not different from 1 (open blue circles), favoring neither direction, and 3 of 17 were >1, favoring the null direction. Lines connect the excitatory and inhibitory conductance sets evoked by the same FM set.