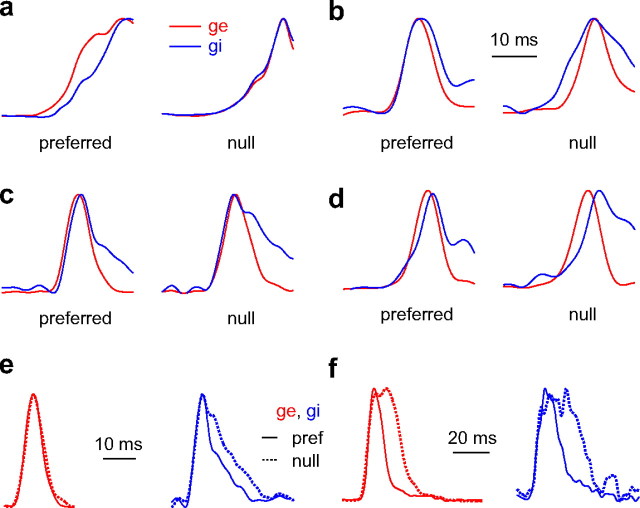
Figure 6.
Temporal asymmetries in the preferred and null conductances. a–d, Four cells that illustrate the variety of temporal relationships between excitation (g e, red) and inhibition (g i, blue) evoked by preferred and null FMs. Timescale for a–d shown in b. Conductances are normalized to peak values. a, Preferred excitation leads inhibition, favoring the preferred sweep direction. b, Null inhibition leads excitation, favoring the preferred sweep. c, No latency asymmetry between excitation and inhibition. Same cell as Figure 4. d, Both preferred and null excitation lead inhibition, but the null latency difference is greater. This temporal asymmetry favors the null sweep. e, f, 2 cells showing different temporal asymmetries in the conductance shapes. Conductances are normalized and aligned at the rise. e, There is no asymmetry in the shape of excitation, but the preferred-evoked inhibition is narrower that the null-evoked inhibition, favoring the null sweep. f, Both the null evoked inhibition and excitation are broader than the preferred. The temporal asymmetry in excitation favors the preferred sweep, but the inhibitory asymmetry favors the null sweep.

