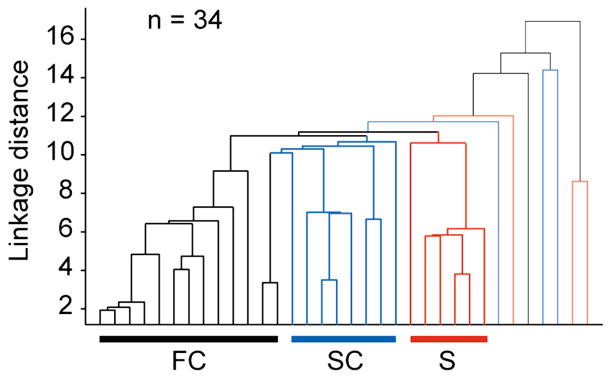
Figure 6. Cluster analysis.
Dendrogram for a cluster analysis illustrating linkage distances across 34 corticogeniculate neurons based on 6 response parameters (antidromic latency, f1/mean, C50, TF high50, area suppression, and direction selectivity). Fast complex cells (FC) are indicated by black lines and mostly cluster to the left (n = 14), simple cells (S) are indicated by red lines and cluster to the right (n = 9), and slow complex cells (SC) are indicated by blue lines and cluster toward the middle (n = 11).

