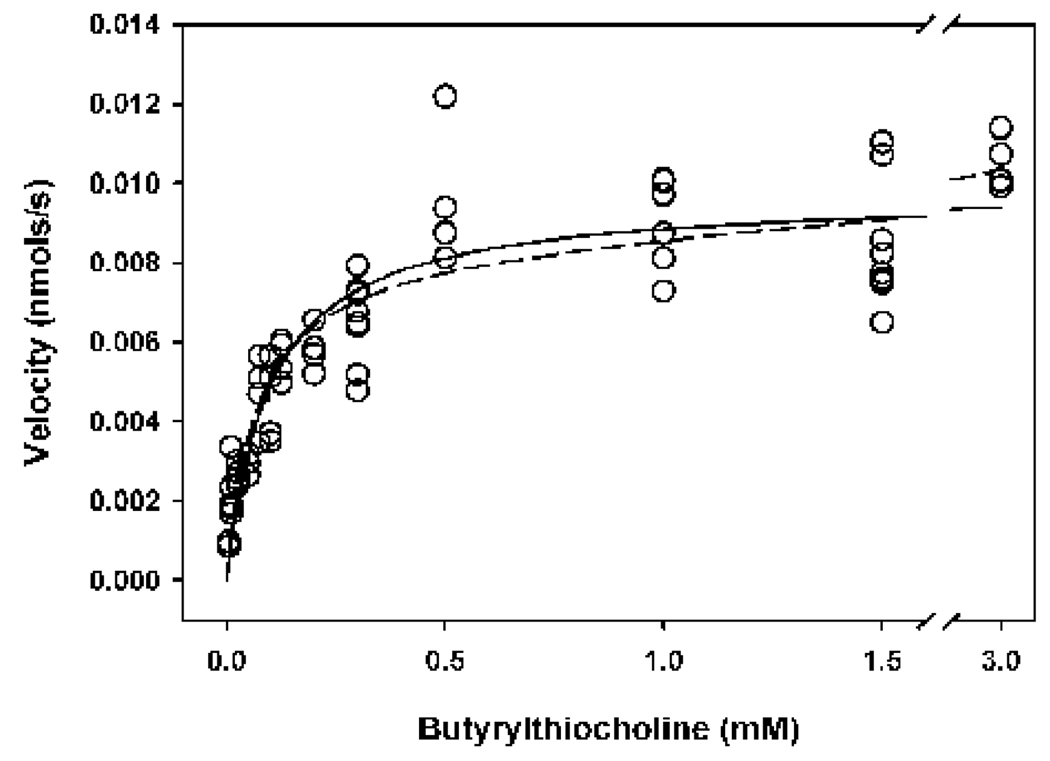
Figure 3. Determination of kinetic parameters descriptive of the hydrolysis of butyrylthiocholine by human butyrylcholinesterase.
The open circles represent empirical data, where each circle is indicative of a single determination of the slope of linear production of thiocholine over 10 minutes at 24°. The enzyme active site concentration was 317 pM. Fitting the data to the Michaelis-Menten equation (equation 1) or the Haldane equation (equation 2) yielded overlapping, indistinguishable fitted curves that are represented by the solid line. The dashed line designates the curve fit to the Webb equation (equation 3). Kinetic parameters are shown in Table 1.

