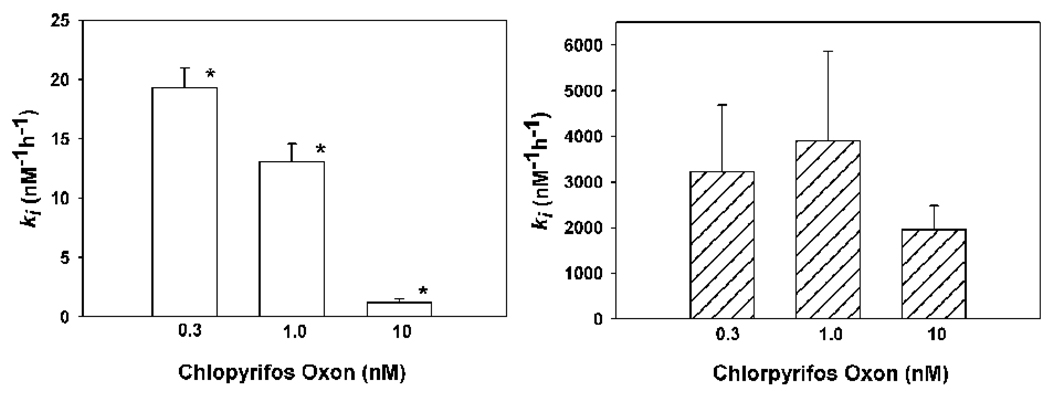
Figure 4. The relationship between chlorpyrifos oxon concentration and ki towards human acetylcholinesterase (left panel) and butyrylcholinesterase (right panel).
Each bar represents the mean ± SD of three-five determinations. The kis were determined at 24° as described by Kaushik et al., 2008. In the left panel the asterisk indicates a significant difference (p<0.05) from the other two groups by a Kruskal-Wallis analysis of variance on ranks, followed by a nonparametric Student-Newman-Keuls Test. In the right panel no significant differences were found between any of the groups by a one way analysis of variance.

