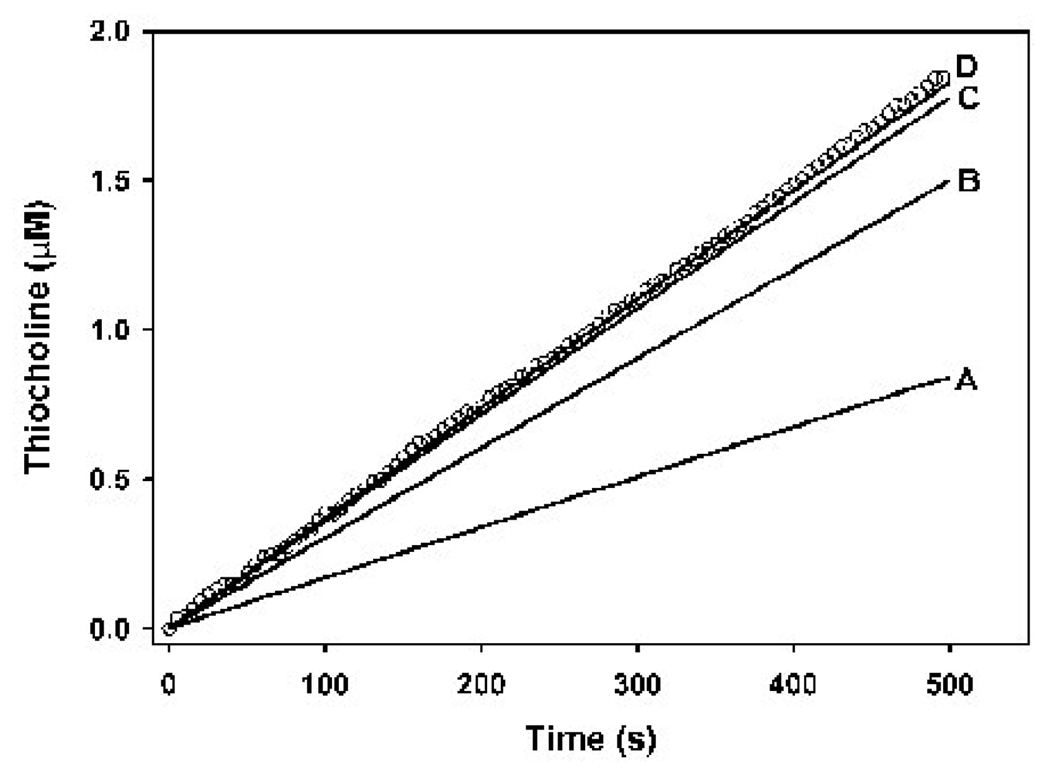
Figure 6. Optimization of the butyrylcholinesterase model for determination of k1BTC.
The solid lines show the model output at different k1BTCs, while the open circles represent a single empirical data set, where enzyme active site concentrations was 159 pM and the butyrylthiocholine concentration was 0.25 mM. Only one empirical data set out of four is shown for visual clarity. The values for k1BTC in the model were as follows: A = 0.01 nM−1min−1; B = 0.05 nM−1min−1; C = 0.25 nM−1min−1; and D = 0.65 nM−1min−1. Increasing the k1BTC beyond 0.65 nM−1min−1 yielded output equal to that for k1BTC = 0.65 nM−1min−1. Therefore a k1BTC of 0.65 mM−1min−1 or greater gave the best fit to the empirical data.

