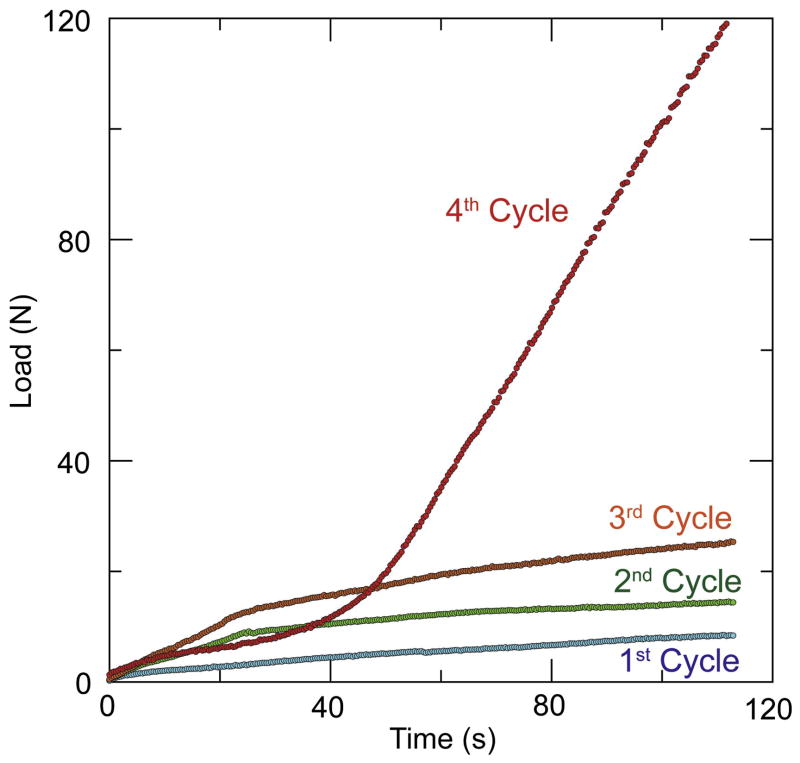
Figure 6.
Flow curves for the RT10 ink corresponding to an equivalent printing speed of 12 mm. s−1. The curves show the effect of solvent migration. The printing load increases and does not reach a steady state and increases with increasing number of cycles (each cycle corresponds with a printing time of 200 s). After four cycles, the nozzle clogged and the remaining ink inside the syringe was completely dry.

