
Fig. 2.
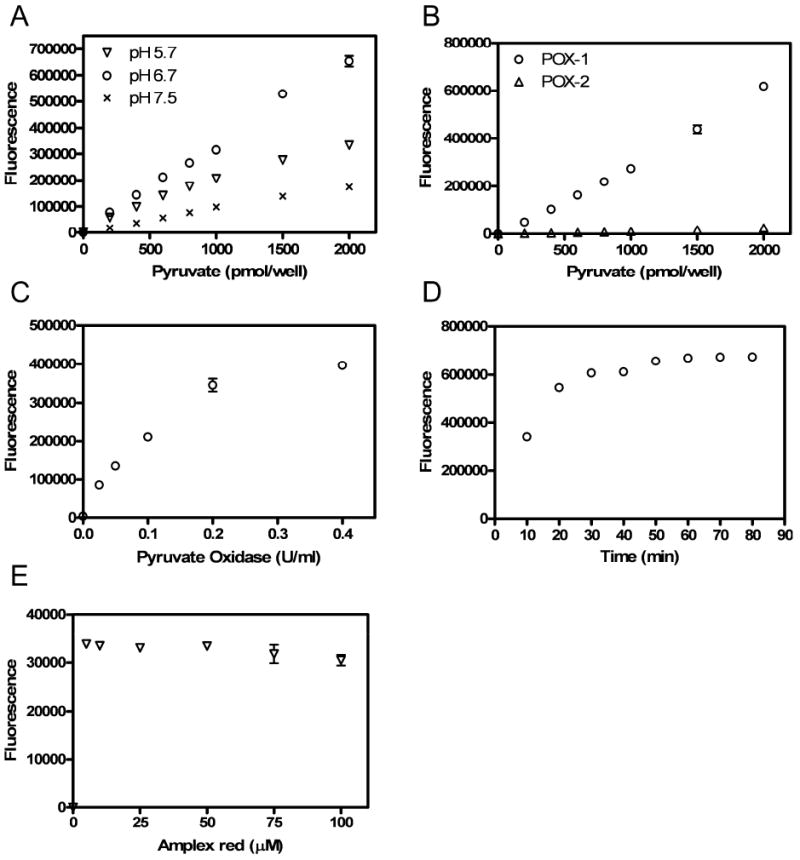
Experiments designed to optimize the assay are shown. A. pH effect on the fluorescence signals. The reaction mixtures contained 100 mM potassium phosphate with 1.0 mM EDTA, 1.0 mM MgCl2, 10 μM FAD, 0.2 mM thiamine pyrophosphate, 0.2 U/ml pyruvate oxidase from bacterial, 50 μM amplex red and 0.2U/ml HRP. B. Effect of pyruvate oxidase type on the fluorescence signals (POX-1: bacterial pyruvate oxidase and POX-2: pyruvate oxidase from Aerococcus sp.) Assays were performed at pH 6.7. C. Relationship of fluorescence intensity and final concentrations of pyruvate oxidase in the reaction mixture (pyruvate: 1 nmol/well). D. Time course of pyruvate assay (pyruvate: 2 nmol/well). E. Dye concentration effect on the fluorescent signals (100 pmol/well). Each datum point is a mean of triplicate measurements; error bars are standard deviations of three separate wells. Error bars are not shown when their sizes are less than those of the symbols.